
Lesson 3a
History of resource flows
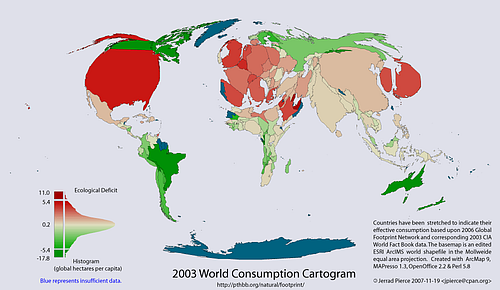
Sustainable development is about how we – humanity – can live on the resources that our planet provides for us. Therefore, the study and understanding of resource flow and resource management is the core of sustainability science. Our resource consumption has increased over the entire history of mankind, but the planet is the same, not any bigger. How can we as humanity adjust to the resources available to us?
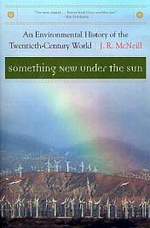
The American historian John McNeill undertook to write a global environmental history for the 20th century. He started assuming that the environmentalists were exaggerating. Yes, there were environmental problems, but there has always been. “Nothing new under the sun” he told them when he started his project. But when he published he had changed his opinion and the title of the book became “Something new under the Sun”. Not surprising! During the 20th century, the human population had increased 4-fold. In addition, the economy per capita had also increased 4-fold. Thus, the resource use on the planet had increased about 16-fold during 100 years. Obviously it cannot go on like that.
Development 1900 – 2000
| global population | increased | 4x |
| global economy | increased | 14x |
| industrial production | increased | 40x |
| energy use | increased | 16x |
| carbon dioxide emissions | increased | 17x |
| sulphur dioxide emissions | increased | 13x |
| ocean fishing catches | increased | 35x |
| number of pigs (=meat eating!) | increased | 9x |
| forests | decreased | 0.8x – decreased 20% |
| agricultural fields | increased | 2x |
| blue whale | 0.0025x – only 0.25 % remain |
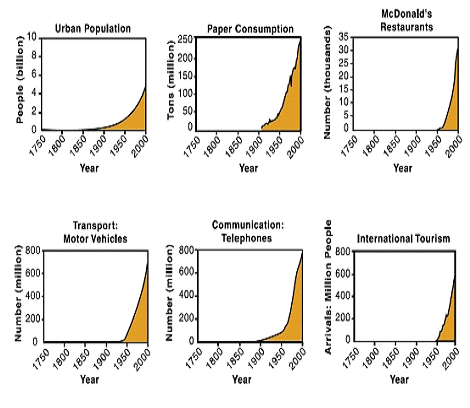
The change was much faster in the end of the century than in the beginning. In fact, increase was most often measured in percent of the previous year! If this percentage growth is constant, we have exponential growth! This means constant doubling time. This gets very soon out of hand. Exponential growth may be illustrated by anything from the number of McDonalds restaurants in the world to the consumption of paper.
In Western Europe, the strongest resource growth was after WWII, roughly between 1955 and 1975. During less than one generation resource consumption increased almost 3-4 fold for very many products: metals, fertilizers, fossil fuels etc. During this period, our societies went from fairly sustainable to affluent societies, affluent meaning with a large resource flow.
It is also during this period that the landfills (rubbish piles) of Europe increased tremendously! Around 1980 concern grew about what to do with the mountains of household waste. This was due to an increasing linear resource flow. The resources went from extraction to production, consumption, and waste in a straight line! It is simply a recipe for resource wasting! To make this more sustainable, we need to have cyclic resource flow. Recycling is an important part of sustainable development (See further Chapter 5c).
The huge increase in resource consumption was especially serious for non-renewable resources. For these there is a finite amount and when used up they are emptied. Most typical are the fossil fuels coal, oil, and gas. But all metals are non-renewable, and so is phosphorus. The extraction of these resources will come to a peak, after which production declines. Peak oil is the point in time when oil will be scarcer. It is happening about now. Peak phosphorus is the time when phosphorus production will decline, a few decades in the future.
Typical is that the accumulation of the end product from using the resource becomes a problem long before the resource is emptied. Thus, the accumulation of carbon dioxide from combustion of fossil carbon is one example, since global warming is caused by carbon dioxide as a greenhouse gas. Accumulation of phosphorus in the environment leads likewise to the problem of eutrophication. Non-renewable resources are further discussed below at Chapter 3c.
Also for renewable resources the consumption has been increasing steeply. Renewable resources are typically plants and animals with a specific reproduction time. If harvest is faster than reproduction, the resource may be destroyed or emptied. An example is fish. Ocean fishing increased about 40 times during the 20th century. It is more than the reproduction rate of the big fish. Today, about 90 % of the big fish in the oceans have been removed by fishing. A number of ocean fish species are threatened by extinction due to over fishing.
In addition to having a value by itself (see Chapter 6a) biological life on the planet in its whole is a resource for humankind as food and in many other ways. The very fast reduction of biodiversity can be seen as the destruction of a renewable resource almost entirely due to human society. It is dramatically illustrated when the early human killed, cooked and ate the last individuals of the European megafauna, mammoth. The European Bison almost faced the same destiny. See further Chapter 6a.
A process of similar kind is loss of organic topsoil, which is disappearing several hundred times faster than it is formed. This also contributes to increased carbon dioxide in the atmosphere. Loss of topsoil happens when the organic material of this black soil is exposed to the oxygen of the air and oxidizes. It may be due to too much tilling of soil, too much draining of wetlands and when soil erodes by wind or water. The process leads to desertification. (See further Session 6a). Topsoil forms slowly as growing plants are composting and rock is weathering.
Loss of forest, deforestation, is also a loss of a renewable resource as it is used faster than it regenerates. Especially, the tropical forest is shrinking at an alarming rate. Loss of forest leads to loss of biodiversity, loss of carbon to the atmosphere and loss of future possibilities to harvest timber and all other products of the forests.
Materials for session 3a
Basic level
- Read A Sustainable Baltic Region, session 3 (pdf): Man and Materials Flows.
- Read A Sustainable Baltic Region, session 3 (pdf): Nature’s Turnover of Materials.
- Read Environmental Science, chapter 2: How the Environment Works – Turnover of matter and energy (pdf).
Medium level (widening)
- Read Environmental Management Book 3, pages 17-28: Society and its Products (pdf).
- Read Environmental Management Book 3, pages 39-52: Resource Flow and Product Design (pdf) in: Product Design and Life Cycle Assessment.
- Read Environmental Science, chapter 9, pages 259-266: A New Regime for Nutrient Turnover – Eutrophication (pdf).
- Read Environmental Science, chapter 12, pages 359-362: Metal Flows and Environmental Impact. (pdf)
Advanced level (deepening)
- Read A Sustainable Baltic Region, session 3 (pdf): The Valuable Metals.
- Read A Sustainable Baltic Region, session 3: (pdf) Nutrient Flows and Environmental Threats.
- Read A Sustainable Baltic Region, session 3: (pdf) The Unbalanced Carbon Cycle – A global problem.
References
Karlsson, S. (ed.). 1997. Man and Materials Flows. A Sustainable Baltic Region. Session 3. Baltic University Press. Uppsala, Sweden.
McNeill, J. R. 2001. Something New Under the Sun. An environmental history of the twentieth-century World. W. W. Norton & Company.
Rydén, L., Migula, P. and M. Andersson (eds). 2003. Environmental Science – understanding, protecting and managing the environment in the Baltic Sea region. Baltic University Press. Uppsala, Sweden.
Zbicinski, I., Stavenuiter, J., Kozlowska, B. and H.P.M. van de Coevering. 2006. Product Design and Life Cycle Assessment. Environmental Management Book 3. Baltic University Press, Uppsala.