Välkommen till Svenska Aralsjösällskapet
The Baltic University Programme
Sustainable Development Course
This course in an update of the earlier BUP course A Sustainable Baltic Region (SBR). The original SBR course was printed and published in 1996 – 1997.
This update was first published on the internet in 2013. Some links and illustrations have been further updated in 2017 and 2023.
Introducing Sustainable Development
You have certainly already many times encountered the term sustainable development. You see it in newspapers, in political discussions and today even in advertisements. It became well known after the United Nations Conference in Rio de Janeiro, 1992. As this was just at the end of the Cold War the nations of the world were unusually united: both East and West, industrialized and developing nations took part. Since then, sustainable development has increasingly become common vocabulary.
Development is perceived as something positive, a qualitative improvement. Sustainable refers to something that can or should last in the long-term. The first reasons for the concern for sustainable development was the fear that the world would not last, that it was on a wrong track. That fear has since then mounted. We see increasing climate change and its consequences: disasters, such as storms, floods, and draughts and a melting arctic ice. We see declining or collapsing fish stocks, biodiversity decline and deforestation. While greenhouse gases in the atmosphere increase unabated, resources such as oil, phosphorus and several metals seem to approach their end. The situation is already an emergency; no wonder that much despair about the future for themselves and their children.
As a counterforce, the idea of sustainable development has become one of the leading aspirations of humankind in our time. Civil society organizations as well as governments all over the world have embraced the concept. It has become the foremost challenge of the 21st century, and the most important tool to address our problems. What is it actually?
Sustainable development is different from many other concepts, as it is so all-inclusive. It includes everything from personal ideas and perceptions, to technical development and political programs. It is based on knowledge, which partly is age-old, e.g. in agriculture, and partly completely new, such as new technologies and social and economic arrangements. As a knowledge-based undertaking, sustainable development is based on a systems approach. One refers to the dimensions of sustainable development as ecological, social and economic, which all are interdependent and all needs to be included. That makes sustainability as a topic of study challenging. In at least some areas, we are all beginners. It also opens up for dialogue and different views and opinions.
But we need this study. We need an ongoing dialogue to foster a shared vision of how to progress to a better future; we need an established theory and practice of sustainable development. With the present course, offered to anyone interested, the Baltic University Programme aims to contribute to this agenda. You are invited as a student to use a part or all of the material. We sincerely hope that you will join the group of those who contribute to a change, and create a better future.
Contents of the BUP
Sustainable Development Course
Main authors
| Lars Rydén | (main responsibilities: text) |
| Christian Andersson | (main responsibilities: website, illustrations) |
| Magnus Lehman | (main responsibilities: links and films) |
Reference group of researches and teachers
Paula Lindroos, PhD, Director Baltic University Programme, Åbo Akademi University, Finland
Martin Hauptvogl, Sustainable agriculture, Energy forest, Slovak University of Agriculture in Nitra, Slovakia
Magnus Andersson, PhD, Environmental policy, Traffic management, Energy management, Cajoma consulting, Sweden
Leena Lahti, PhD, Environmental education, University of Eastern Finland
Kristina Abolina, PhD. University of Latvia, Riga.
Tatjana Tambovceva, Prof. Economics and management, Riga Technical University, Latvia
Per-Arne Lindström, Sweden
Oleksandra Kovbasko, Freshwater Officer at WWF Danube-Carpathian Programme, Austria.
Linas Kliucininkas, Prof. Environmental management, Kaunas University of Technology, Lithuania
Tiina Elvisto, Prof. Plant ecology, Tallinn University, Estonia
Jan – Otto Anderson, Prof. Environmental economics, Åbo Akademi University, Finland
Marie Thynell, PhD. Sustainable development, Sustainable transport. University of Gothenburg, Sweden
Ciegis Remigijus, Prof. Development economics, Vytautas Magnus University, Lithuania
Michael Goodsite, PhD. Atmospheric chemistry, climate and global processes. Aarhus University, Denmark
Irek Zbicinski, Prof. Environmental management, Life-cycle assessment, Łódź University of Technology, Poland
Alexander Feher, Prof. Sustainable agriculture, Slovak University of Agriculture in Nitra, Slovakia
Jakub Kronenberg, PhD. Economy – environment interactions. University of Łódź, Poland
Kalev Sepp, Prof. Landscape management, Estonian University of Life Sciences, Estonia
Daniel Bergquist, PhD, Urban agriculture, Uppsala University, Sweden
Siarhei Darozhka, Prof. Environmental management. Belarusian State University, Belarus
Lars Emmelin, Prof. Sustainability planning, Blekinge Institute of Technology, Sweden
Henrik Knudsen, Prof. Innovation, entrepreneurship. Aarhus University, Denmark
Artur Pawłowski, PhD. Lublin University of Technology, Poland.
BUP Sustainable Development Course
1a.
Stories of societies which succeeded or collapsed

Sustainable development deals with the long-term prosperity or collapse of societies. Why is this a concern for us? The societies and countries we live in have a long history, thousands of years. Should we expect a collapse in the near future? Nevertheless, it is a threat that many are concerned with when it comes to the global society, all countries in the world. Collapse then does not mean eradication, but rather that there will be fundamental changes in the way things work. The reasons are that basic resources for us are coming to an end. Thus, fossil fuels, coal, oil and gas, become more difficult to find and prices are mounting. The so called “peak-oil”, the time of maximum production, has already passed for conventional oil and the peak approaches rapidly for other kind of fossil resources. At the same time the climate change caused mostly by the human combustion of fossil carbon and its consequences – disasters, such as storms, floods, and draughts and a melting arctic ice – aggravate. We also see declining or collapsing fish stocks, biodiversity decline and deforestation, and an increasing population on the planet. Will there be enough food for everyone? A basic requirement for today’s agriculture – production of phosphorous – is also rapidly emptied.
The concern for sustainable development is thus caused by questioning the continued successful development. Will we succeed or collapse? It is not difficult to find examples of societies which collapsed. The best known may be Easter Island. Easter Island is a small island in the vast expense of the Pacific outside the coast of Chile. It is known for its enormously large statues of human heads made of stone. When western seafarers “discovered” the island (on Easter day) in the 18th century, there was only a small group of people living in terrible conditions in a barren landscape. The stone heads witnessed about a once flowering society, which now had collapsed. An important reason of the collapse of the society was apparently the loss of the forest. The absence of trees made it impossible to build boats or canoes to fish, or to build decent houses.
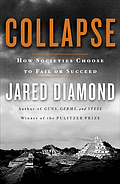 The American geographer and physiologist Jared Diamond in his book “Collapse – how societies choose to fail or succeed” analyses a dozen societies, including the Easter Island, which failed, most of them ancient but some contemporary. He does not blame individuals, for example the person who cut down the last tree on Easter Island, but looks for developments in the societies. It is clear that they have a few things in common. On top of the list of causes of collapse are environmental impacts, in particular deforestation and destruction of soil.
In today’s discussion on sustainable development, deforestation is still a concern. Deforestation is driving climate change and is a main cause of biodiversity loss. It is included in the global negotiations on climate change under the title REDD, Reducing Emissions from Deforestation and forest Degradation. It is today mostly a question for the Southern Hemisphere, the tropical forests, but also in our societies we had a deforestation crisis, but in the 18th century. The forests were becoming clear-cut due to the large consumption of wood. It is interesting to note how the “crisis” was managed and avoided then; it is relevant for how we do today. The dealing with the European forest crisis led to the introduction of the term “Sustainability” for the very first time.
 Our development has lead to societies in which most people have better, longer and healthier lives than earlier generations, but it had a price. Today’s concern for sustainable development is not in the first place concerned with a specific country. Again, it is as a global society we over-use the resources of our planet. We cut down forest, we over-fish the oceans, we use more energy than the Earth can provide in the longer term; and the end products from human activities pollute the environment too much. If this continues at some point it will lead to collapse, just as was the case in many societies, which already collapsed. Understanding and knowing sustainable development is needed to avoid this and instead create a prosperous future for this and coming generations.
Material for session 1a
Basic level
- Read the story of the Easter Island by Sverker Sörlin.
- Watch the film with Sverker Sörlin on Easter Island (YouTube film).
- Read the European Forest Crisis and the origin of the sustainability concept.
- See Jared Diamond introduce his book Collapse on collapsing societies (YouTube film).
Medium level (widening)
- View a presentation by Lars Rydén on: Climate Existence Seminar on Resources.
- Read Environmental Science, chapter 25, pages 767-771: The Prospect of Sustainable Development or The Prospect of Sustainable Development (in Russian)
- Study the Mayan deforestation and the consequent collapse of the Mayan society. Also study Mayan and modern farming in Central America.
Advanced level (deepening)
Study in some detail an example of change from collapse to prosperity:
- Paolo Lugari, founder of Las Gaviotas (YouTube film)
Additional material
The film Home or Дом (in Russian) was made in 2009 to inspire all of us to be careful about our home planet Earth now in danger and avert the depletion of natural resources. It is a remarkable film., 1 hr and 33 min.
References
Diamond, J. 2005. Collapse – how societies choose to fail or succeed. Viking Books.
Rydén, L., Migula, P. and M. Andersson (eds). 2003. Environmental Science – understanding, protecting and managing the environment in the Baltic Sea region. Baltic University Press. Uppsala, Sweden.
Sörlin, S. 1997. The Story of Easter Island. In: A Sustainable Baltic Region 1. The road towards sustainability – a historical perspective. Baltic University Press. Uppsala, Sweden.
BUP Sustainable Development Course
Sida 4 av 15